


 Sequencer Products: SEQ ALL
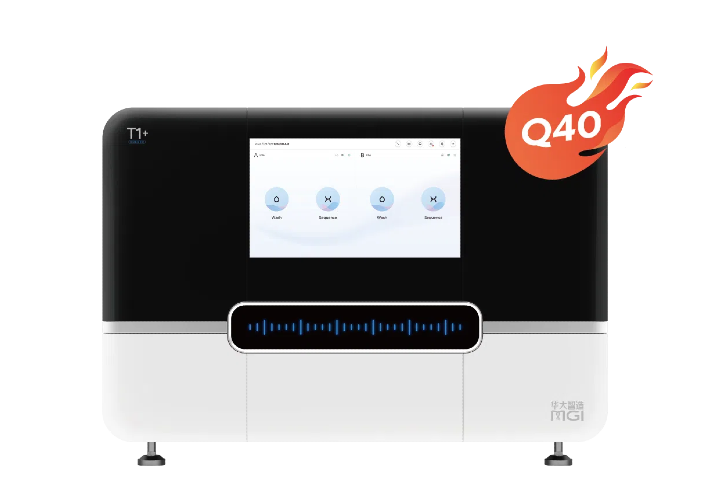


 Technologies
 Applications
 Online Resources
 Data Bulletins
 Service & Support
 Global Programs
 Introduction
 Newsroom
 Doing Business With Us
 Creative Club


Shenzhen, China, 5 September 2025 - MGI Tech Co., Ltd. ("MGI"), a company dedicated to developing core tools and technologies that drive innovation in life sciences, announced the extension of applications of MGIEasy Fast FS Library Prep Set V2.0. This enables ultra-low DNA input library preparation, enhancing the flexibility of experiments and providing a wider range of application scenarios for research exploration.
MGIEasy Fast FS Library Prep Set V2.0 combines the fragmentation, end-repair and A-tailing into one step, simplifying the preparation process and significantly shortening the DNA library preparation time to 2 hours. Recently, the species abundance in trace Meta gDNA samples(1 pg to 10 pg) has been effectively detected with the optimized ultra-low DNA input library preparation workflow. It enables efficient and rapid library preparation for trace samples, showing comprehensive performance in ultra-low input library preparation applications, and greatly improves the utilization of precious samples. In addition, it also provides a library preparation solution for the analysis of microbial community abundance and composition in certain trace samples from scenarios such as extreme environments and ecological research.
MGIEasy Fast FS Library Prep Set V2.0 features several highlights that eusure a streamlined library preparation workflow:
n Breaking trace sample input limitations: Enables library preparation from trace samples as low as 1 pg.
n High-quality library preparation: Optimized workflow ensures high-quality library construction with extremely low sample input amounts.
n High sensitivity and accuracy: Excellent sequencing quality and accurate detection of low-abundance nucleic acid sequences.
The following is a performance demonstration for MGIEasy Fast FS Library Prep Set V2.0:
1. High-quality library preparation
MGIEasy Fast FS Library Prep Set ultra-low input library preparation workflow was used for library preparation with varied initial DNA input amounts (1 pg, 5 pg and 10 pg) based on ZymoBIOMICS™ Microbial Community DNA Standard. The results showed that with 1 pg, 5 pg and 10 pg of sample input, the library yields were ~95 ng, ~100 ng and ~190 ng, respectively. This result can meet the needs of downstream high-throughput sequencing, indicating the efficient utilization of trace samples (Fig.1). The Agilent 2100 Bioanalyzer results showed that the library fragment distribution at different initial input amounts is highly consistent, with an expected amplicon size and no primer dimer or other non-specific peaks (Fig.2).
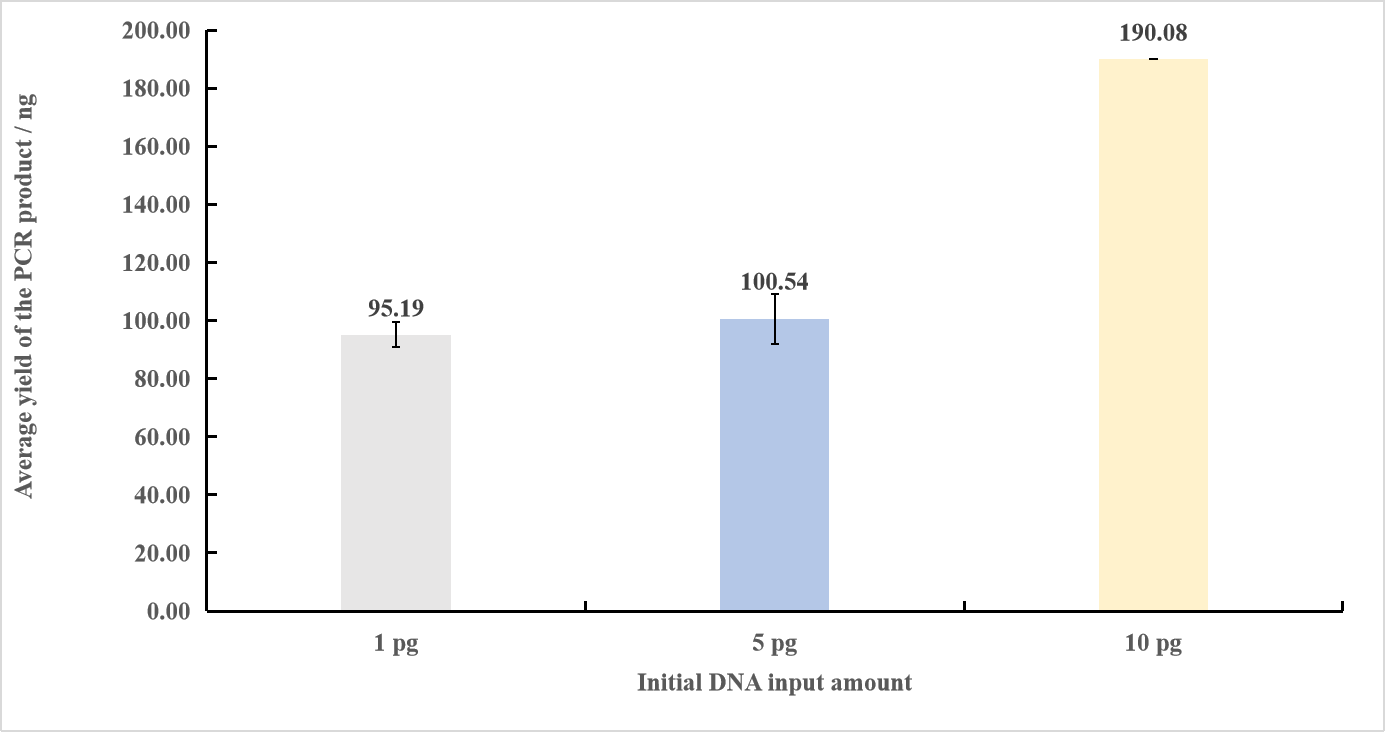
Figure 1. PCR yields for library preparation using different initial DNA input amounts. Each input amount was tested in triplicate. The number of PCR cycles for 1 pg was 22, and the number of PCR cycles for 5 pg and 10 pg was 20.
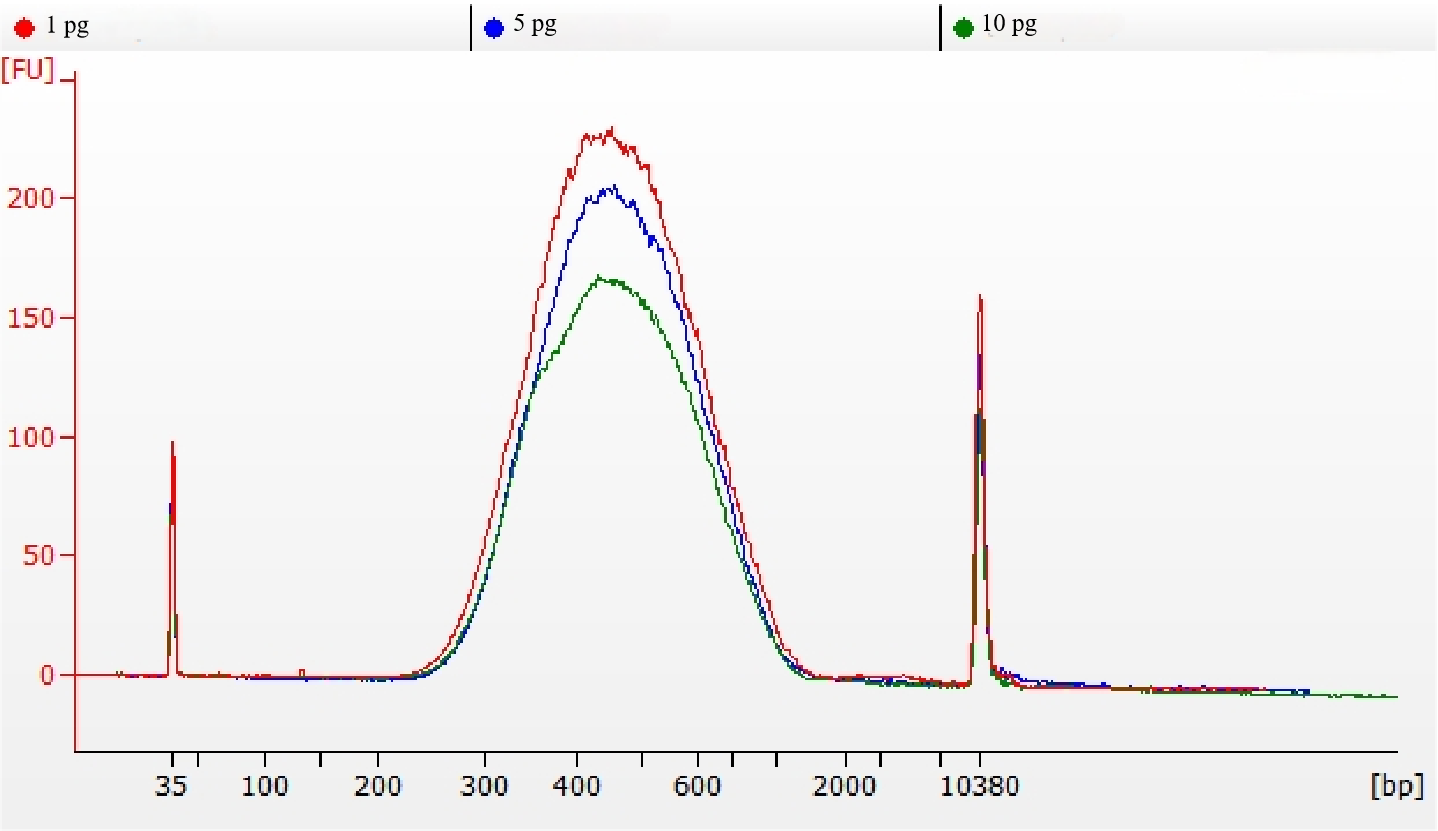
Figure
2. Agilent 2100 Bioanalyzer electropherograms of libraries with different
initial DNA input amount.
2. Sequencing quality performance
Library sequencing was performed on DNBSEQ-G400 with PE150. High-quality sequencing data was obtained with a total of 515 M reads data output, Q30 exceeding 90% and Split rate exceeding 95% (Fig.3A). From the base sequencing quality distribution diagram (Fig.3B), it showed that the mass values remain stable at each of the sequencing cycle, indicating that the high quality of sequencing data, which met the needs of downstream deep analysis.
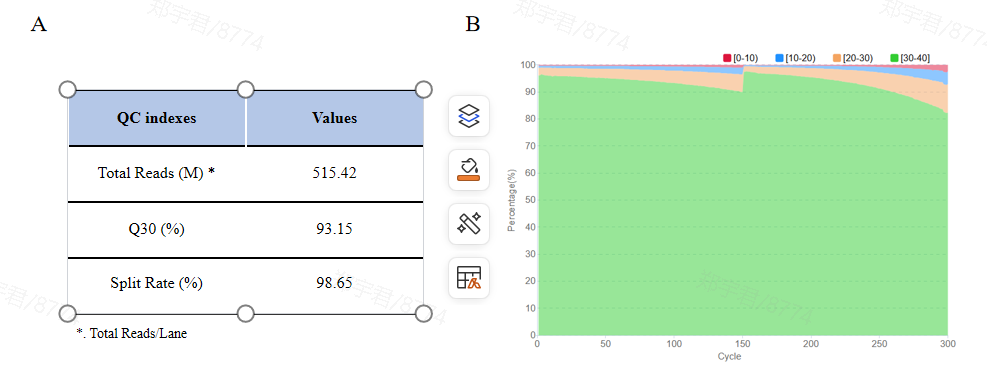
Figure
3. Sequencing quality.
3. Stable performance indicators
PFI was applied for data analysis after sequencing. The species abundance analysis was performed on one replicate randomly selected from each of the 1 pg, 5 pg and 10 pg input groups. The measured data showed that the abundance of microbial composition across different initial sample input amounts was consistent as expected. (Fig.4,Table 1). For example, at the input amount of 1 pg, the relative abundances of Pseudomonas aeruginosa, Escherichia coli, Salmonella enterica, Lactobacillus fermentum, Enterococcus faecalis, Staphylococcus aureus, Listeria monocytogenes, Bacillus subtilis, Saccharomyces cerevisiae and Cryptococcus neoformans were 14.61%、11.64%、11.81%、11.02%、11.33%、11.38%、10.48%、10.65%, 1.47% and 1.38%, respectively, which were consistent with theoretical proportions. Similar results were observed at other input amounts (Table 1).
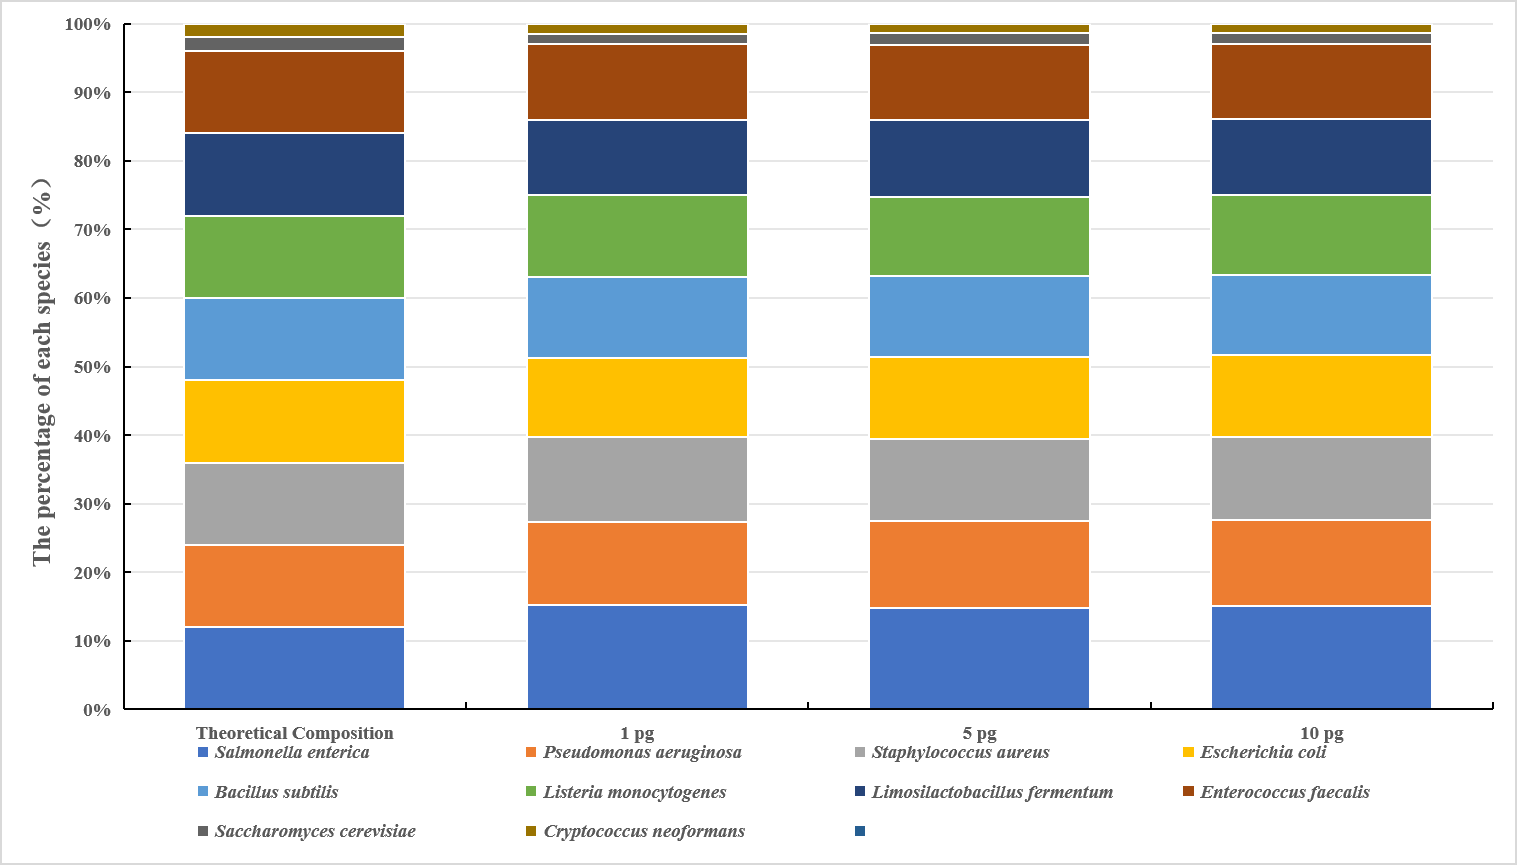
Figure 4. Species abundance of different initial DNA input amounts. The abundance of microbial composition at different initial DNA input amounts (1 pg, 5 pg, 10 pg) were close to the theoretical composition.
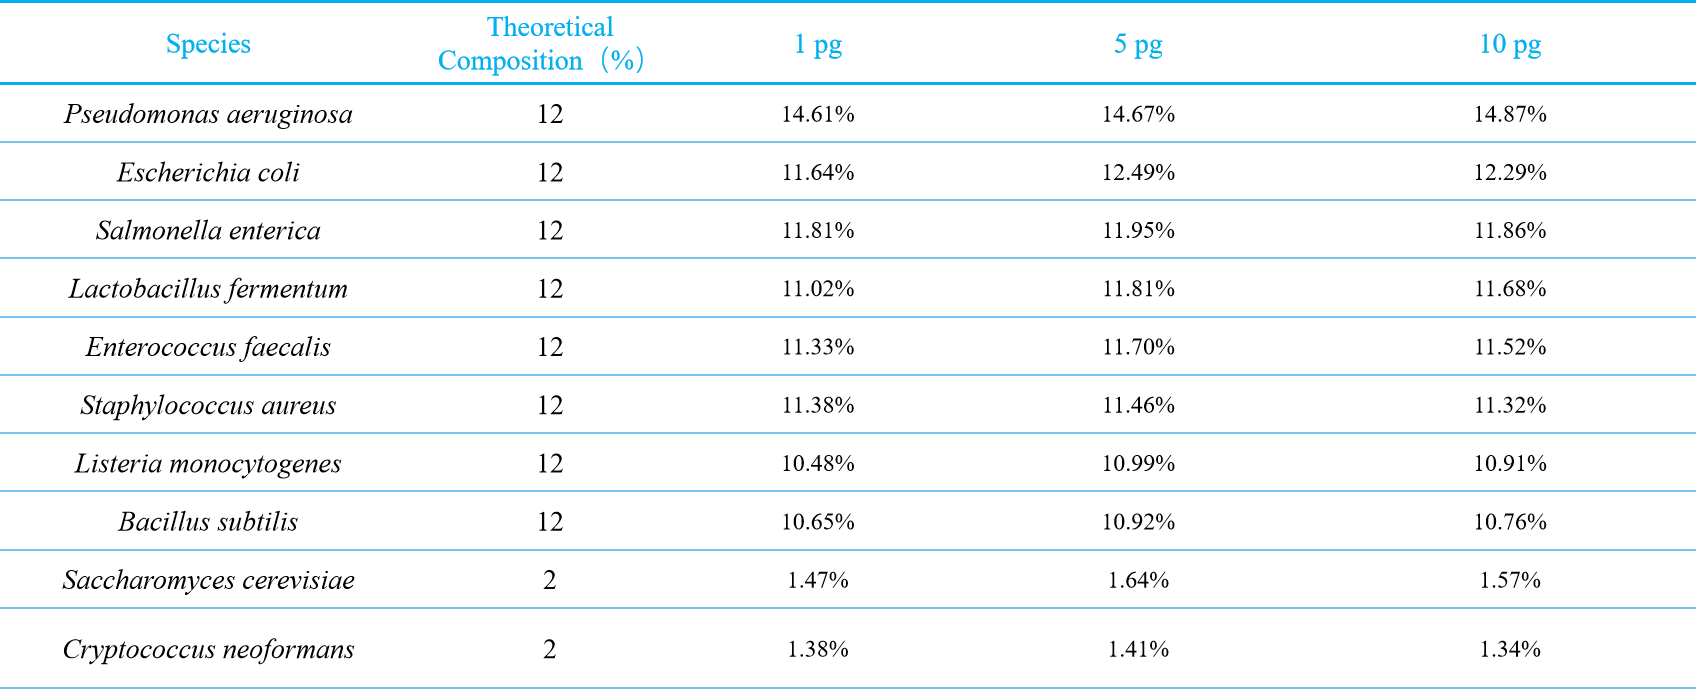
Table 1. Test results with different sample input amounts
Spearman correlation coefficients between samples with different initial input amounts and the theoretical composition were calculated. The results showed that the correlation coefficients between samples with initial input amounts of 1 pg, 5 pg and 10 pg and the theoretical species composition were 0.9927, 0.9953 and 0.9942, respectively. Meanwhile, the correlation coefficients between samples with different initial input amounts were all as high as 0.99 (Fig.5). This indicates that the species abundance distribution patterns of samples with different initial input amounts are highly consistent, which can effectively support comparative analysis between samples with different initial input amounts. It also suggests that the ultra-low input library preparation workflow can generate stable and comparable species abundance data with as low as 1 pg to 10 pg input.
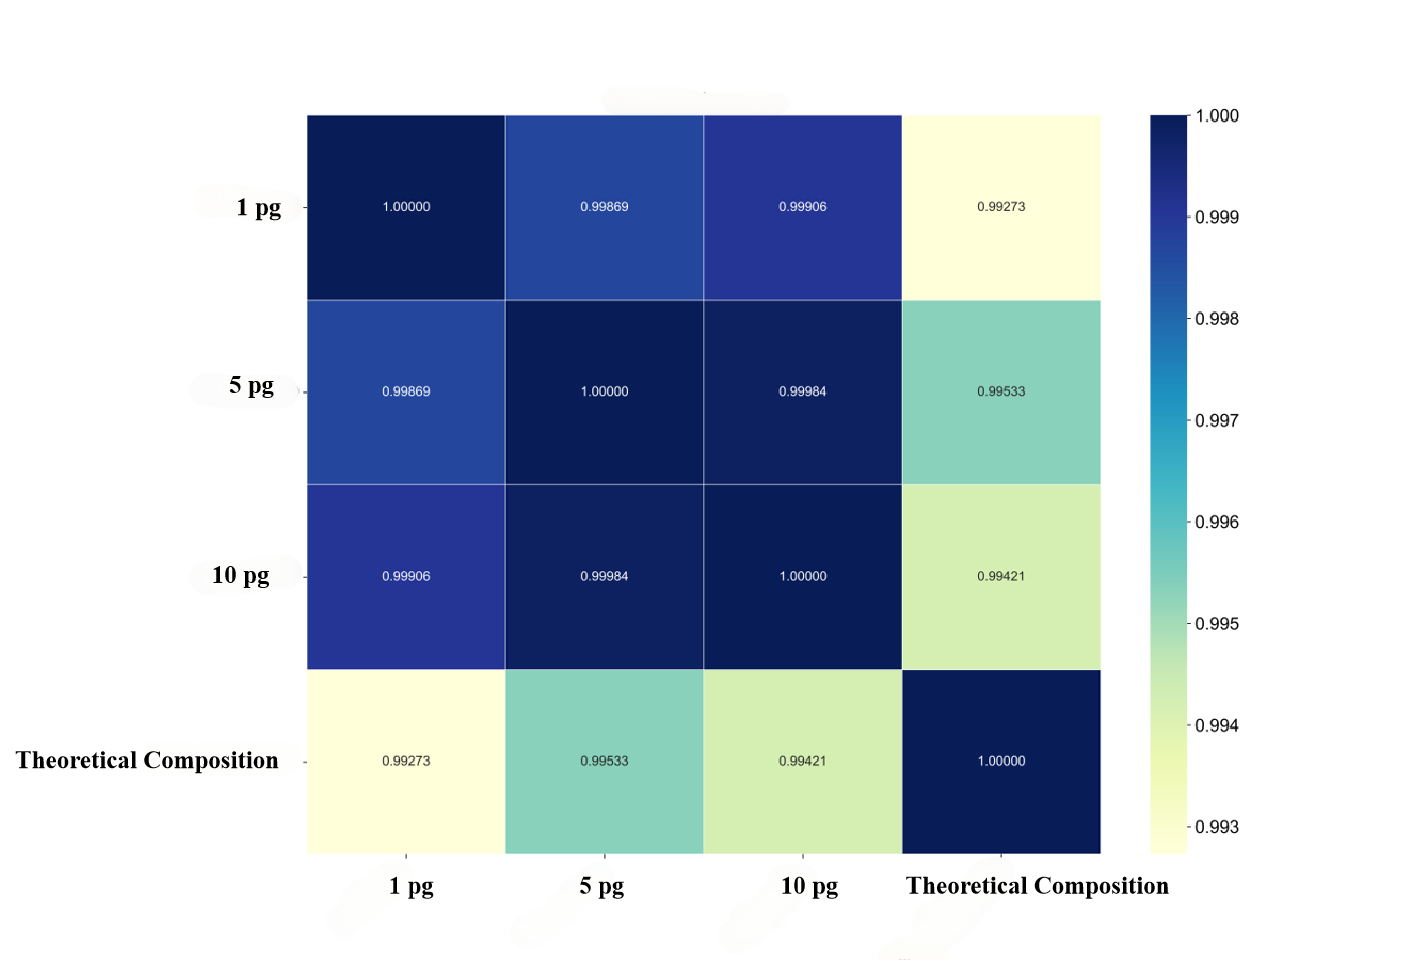
Figure
5. Spearman correlation coefficient of species abundance at different initial
DNA input amounts.
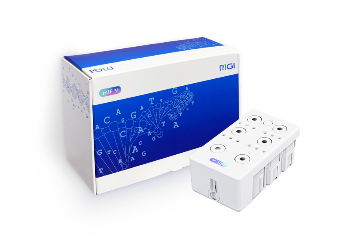
Recommended Ordering Information
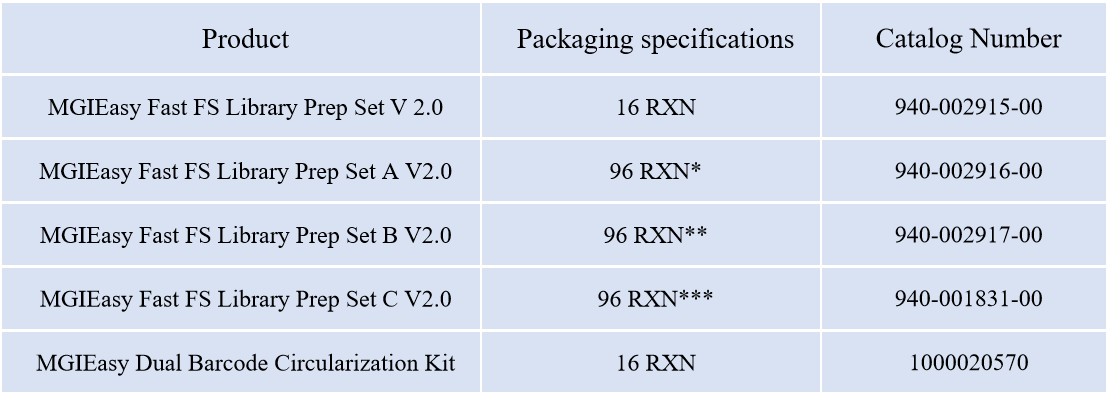
*:With MGIEasy UDB Primers Adapter Kit A ;
**:With MGIEasy UDB Primers Adapter Kit B;
***:With MGIEasy UDB Primers Adapter Kit C;
For more information about MGIEasy Fast FS Library Prep Set V 2.0, please visit: https://en.mgi-tech.com/Products/reagents_info/id/79